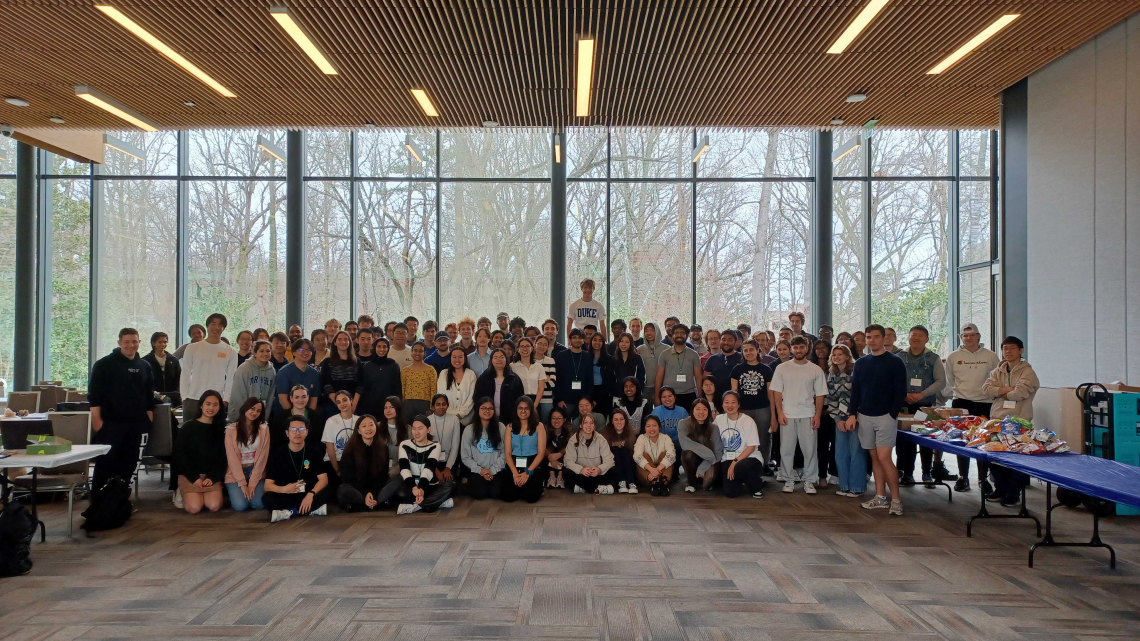
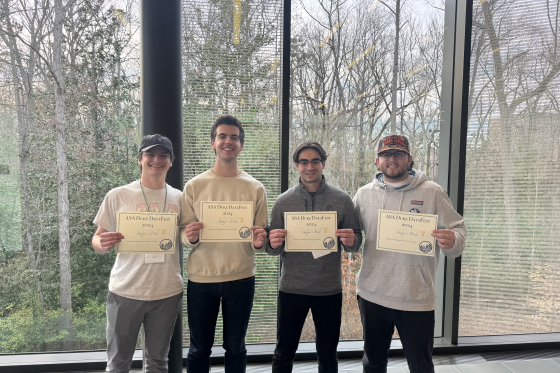
Students from across Duke and the University of North Carolina Chapel Hill participated in Duke DataFest in March 2024.
Students Put Classroom Skills Into Practice at Duke DataFest 2024
In March, teams of students from Duke and UNC participated in the annual DataFest competition, hosted at Duke. Organized by the American Statistical Association (ASA), DataFest is a celebration of data, in which teams of undergraduates work around the clock to find and share meaning in a large, rich and complex data set.
DataFest was founded at the University of California, Los Angeles (UCLA) in 2011, with only 30 students. This year, Duke’s DataFest welcomed 195 students, including 95 from Duke and 90 from UNC. Besides Duke's event, 54 other ASA DataFest 2024 competitions were hosted globally by colleges and universities or multi-institution teams.
Organizing a weekend-long in-person competition in Penn Pavilion takes a great deal of advanced planning. At Duke, the event was organized by students, staff and faculty members in the Department of Statistical Science, including Professor of the Practice of Statistical Science Mine Çetinkaya-Rundel and Assistant Professor of the Practice of Statistical Science Alexander Fisher. Before joining Duke Statistical Science, Çetinkaya-Rundel helped found the ASA DataFest at UCLA. She currently co-leads the international effort. Fisher is the current organizer of Duke DataFest.
Faculty, staff and alumni from all over Duke served as volunteer judges and mentors. The Statistical Science Majors Union provided volunteer hosts; their officers assisted with publicity and obtaining financial support, while other students provided design and technical support. Statistical Science staff members, particularly Anne Clark, organized logistics. Duke's OIT provided Docker Containers, sufficient wifi bandwidth and audiovisual support for the weekend.
At DataFest, students wrangle a complex dataset, coming up with a research question and conducting the appropriate analysis to answer it. For this year’s competition, the dataset in question revolved around the patterns of use and student learning outcomes of an online statistics and data science textbook called CourseKata.
“DataFest is an opportunity for students to use the skills they learn in the classroom to analyze a real, messy, and massive data set, sometimes for the first time,” says Fisher. “The objective is open-ended, and while the event is only a weekend long, it is the moments of struggle and triumph that forge lasting memories.”
Find more about the award-winning teams from this year’s DataFest competition, and read about these students’ unique experiences:
- Best Insight — Tomato Team (Duke): Evan Glas, Henry Holbrook, Ben Perry, Addison Phelps, Roy Chen
- Best Use of Outside Data — Team TKGA (Duke): Anmol Sapru, Tate Staples, Gabriel Paley, Kevin Lee
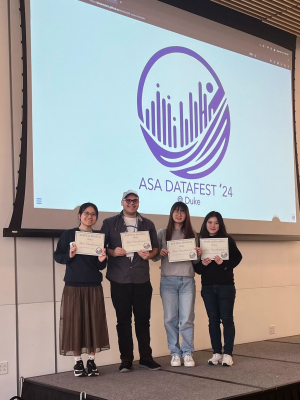
- Best Visualization — Jelt Jian (Duke): Eric Rios, Lisa Wang, Luopeiwen Yi, Jiavi Zhou
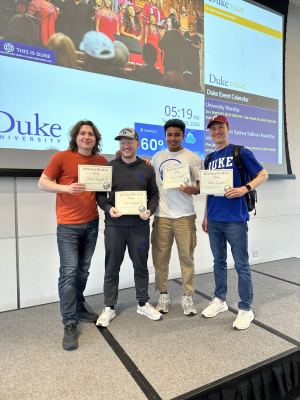
- Judge’s Pick — JL and the Jets (Duke): Alex Katopodis, Miles King, Jonathan Levitan, Jackson Peurach
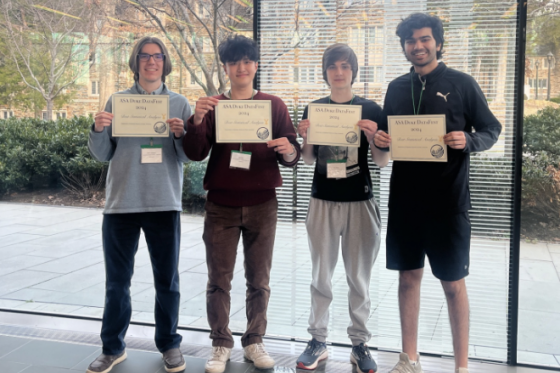
- Best Statistical Analysis and Overall Best Project — 283 Boys (UNC): Eddy Ding, Daniel Henderson, Maxim Chadaev, Siddhant Borkar
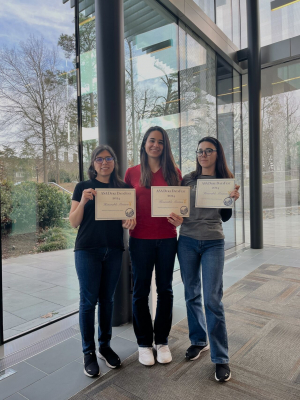
- Honorable Mention — Data MIDS (Duke): Gunel Aghakishiyeva, Daniela Jimenez, Shaila Guereca
- Honorable Mention — Team08 (UNC + Duke): Senam Adedze, Sonia Zhu, Wangley Soares Martins, Mia Lam, Sam Reid
Henry Holbrook ‘24
Computer Science major, Finance minor
Team Tomato, Duke
How did your team come up with the ideas you presented about the dataset?
We were initially looking to find useful features to predict student outcomes, and one such feature we came up with was whether or not they cheated. We considered someone to have cheated if they had the same character-for-character response as another student on a free response question. We only considered ones in which the response was at least 100 characters, in order to minimize false positives. Once we ran the numbers and saw how widespread cheating was, we decided to focus solely on it for our project. Once we dug in, we found that these students were getting their answers online, from sites like Quizlet, and that the answers they were copying were the first ones that popped up when searching the questions in Google.
What was your most interesting insight into the dataset?
Our most interesting insight, which led us to win in the Best Insight category, was that there was widespread cheating throughout the course. This cheating (blatant copy-pasting from online sources like Quizlet) was also correlated with lower engagement and lower scores on the exam.
What advice would you give to a first-time DataFest team?
Try to think outside the box. Come up with multiple different ideas, because the first few you think of are probably what everyone else is going to do. We were initially going to analyze student outcomes, just like most other teams, but it was doing something different, cheating detection, that set us apart and allowed us to be successful.
Gabriel Paley ‘27
Economics and Statistical Science major
Team TKGA, Duke
How did your team come up with the ideas you presented about the dataset?
During DataFest, our team was truly inspired by the sheer talent and expertise surrounding us. We spoke with other teams employing advanced techniques like k-means clustering, machine learning and various sophisticated statistical methods. Around midday on the first day, we chose to focus on our own experiences as students to carve out a unique approach, instead of depending solely on advanced statistics. We devoted several hours to reading the textbook, reflecting on our own learning processes, and evaluating the advantages and disadvantages of the material from a student's perspective. We noted a distinct pattern: some chapters were simply long, both visually and in word count. We found ourselves drawn to shorter, more concise text, and in sections where videos were available, we naturally gravitated towards them.
What was your most interesting insight into the dataset?
These observations guided our statistical thinking and led us to highly actionable conclusions. We decided to create a variable to measure the scrolling length of each section by calculating the pixel length of every section using a virtual ruler. To ensure statistical accuracy, we controlled for variables such as the number of questions per section, the word count, and the chapter difficulty. Our analysis revealed a significant negative correlation between the number of pixels and student engagement, isolating the impact of excessive white space on student idle times (think more modular formatting, less unnecessary space, etc.). Additionally, we systematically collected word counts for each section and found a similar decrease in engagement associated with increases in word count, after controlling for chapter difficulty. We also found that there was a significant number of students who, similarly to us, idled during the text-heavy sections, but displayed much stronger engagement with videos (not true vice versa).
What advice would you give to a first-time DataFest team?
Based on my experience in the competition, I would strongly encourage future teams to connect personally with the dataset provided and develop well-grounded hypotheses before diving too deeply into the data itself. It is easy to become overwhelmed with hundreds of variables, millions of data points, and seemingly countless relationships to explore without this grounding. Data, first and foremost, empowers researchers to find compelling stories and make real suggestions, so it's crucial to establish a foundational understanding and clear objectives early on.
Luopeiwen (Tina) Yi ‘25
Master in Interdisciplinary Data Science (MIDS)
Team Jelt Lian, Duke
How did your team come up with the ideas you presented about the dataset?
Our team formulated our ideas based on a thorough analysis of the CourseKata dataset. We identified key patterns and trends within the data, focusing on improving student learning experiences on the CourseKata platform.
Did working on this dataset give you any ideas about your own online learning experiences?
Working on the CourseKata dataset provided valuable insights into online learning experiences. We recognized the importance of tailored materials and support mechanisms, especially for learners from diverse academic backgrounds.
What advice would you give to a first-time DataFest team?
For first-time DataFest teams, we recommend focusing on thorough data exploration and leveraging diverse perspectives within the team. Additionally, effective communication and collaboration are key to success in analyzing complex datasets within a limited timeframe.
Anything else we should know about your experience at Duke DataFest?
Our experience at Duke DataFest was enriching and insightful. We appreciated the opportunity to apply our statistical and data science skills to real-world problems and collaborate with peers and mentors in the field.
Edward Ding ‘27
Computer Science and Statistics major
283 Boys Team, UNC

How did your team come up with the ideas you presented about the dataset?
We found our ideas through a lot of trial and error, cycling through several possible ideas that yielded no solid results; it was just a lot of exploration with hypothesized data generating processes and experimenting with different variables.
Did working on this dataset give you any ideas about your own online learning experiences?
I think our insights really made me aware of the effect difficulty spikes in my online learning. It really brought to my attention how the consistency in difficulty and pacing of one’s learning experience plays a major role in the effectiveness of one’s learning and their persistence through it: Applied to my personal experiences, sudden spikes or drops in difficulty definitely throws my learning experience off balance and is something that should be addressed in any online learning platform.
What was your most interesting insight into the dataset?
I think our most interesting insight would be uncovering the underlying spikes in perceived difficulty for some specific difficulty, whether some are very easy or especially difficult. Looking beyond just high or low end of chapter scores, we compared this against engagement time and found that some chapters took much more engagement and effort to get better scores and vice versa. After creating a difficulty metric for every chapter, we found endless applications for it, including its application in a proven machine learning environment presented in a research paper.
What advice would you give to a first-time DataFest team?
For those that are participating in a DataFest for the first time, I say don’t be too nervous and really prioritize treating the experience as a learning experience and quality bonding time with your teammates. It was also our first DataFest so it was definitely unfamiliar and a little nerve wracking, but you will soon find it to be a great environment with many amazing people, and overall a fun and enriching experience for everyone.
Daniel Henderson ‘27
Computer Science major
283 Boys Team, UNC
How did your team come up with the ideas you presented about the dataset?
The ideas that we came up with mostly came from looking at the data and brainstorming things we could try to discover from it. We filtered for the best ones by simply asking "how would this discovery be useful?" Despite this, the first thing that we decided to work on actually ended up not being what we presented. Luckily, we had only invested about half a day of time into our first idea at that point and were able to easily switch to another topic with more actionable findings.
Did working on this dataset give you any ideas about your own online learning experiences?
Not necessarily working with the dataset, but definitely from hearing the presentations of other teams. A lot of trends that they discovered connected well to my personal experiences. For example, there was a team that presented on how certain question-types in the course were merely graded for participation and how lower effort was put into those portions of the course by students. From my experience, this is definitely how things work.
What advice would you give to a first-time DataFest team?
The first thing I would say is to try to find something useful. Don't work on things purely because they are interesting. Another is to not hesitate in discarding a topic if the data it gives you is inconclusive. I saw a good portion of teams presenting with bad p-values and uncertain findings, and I feel like that is the reason why they didn't win an award.
Siddhant Borkar ‘27
Computer Science and Biostatistics major
283 Boys Team, UNC
Did working on this dataset give you any ideas about your own online learning experiences?
Absolutely. Our key insight was for CourseKata to provide an incremental increase in difficulty through their tests and units. As a first year, I commonly see this technique used in my introductory classes, where the end of the course becomes more difficult.
What advice would you give to a first-time DataFest team?
Sometimes, simple is better. I was really intimidated when I saw the other teams had implemented machine learning models on the data, and thought there was no chance of getting the award for statistical analysis. But what made our project stand out was that it was logically sound. It didn’t take much statistical knowledge to understand, and provided an accurate and insightful result, without over-complicating the process. Also, how you present your content is just as important as the content itself.
Anything else we should know about your experience at Duke DataFest?
Duke DataFest has shown me the importance in being proficient at using statistical analysis methods as a computer scientist. It’s because of this event that I’ve selected a double major in biostatistics. I hope Duke DataFest continues to provide amazing experiences to ambitious students. Duke DataFest was AWESOME!
Gunel Aghakishiyeva ‘25
Master in Interdisciplinary Data Science
Data MIDS Team, Duke
This was the first DataFest for me and my team. We kicked off with a bunch of ambitious ideas but quickly realized we needed to narrow them down because we only had two days. Working on the dataset, we saw a pattern: online learning experiences are pretty similar across the board. It made us think about how important it is to design learning platforms that really engage students. It's not always about students not wanting to learn; sometimes, it's about how the material is presented to them.
Our team is made up of students from the Master in Interdisciplinary Data Science program. DataFest was a fantastic chance for us to apply what we've learned in a way that blends the social and technical sides of data science, which is what our program is all about.
What was your most interesting insight into the dataset?
The coolest thing we found out, thanks to my teammate Daniela, was that students' opinions on whether course material was useful or interesting linked back to their grades. Essentially, if students didn't find the material engaging, they tended to score lower, which really hits home how key engagement is to success in education.
What advice would you give to a first-time DataFest team?
If I had one piece of advice for first-timers at DataFest, it would be not to get lost in the technical weeds. Have fun, look for interesting tidbits in the data, and think about how to make your presentation catch the audience's attention. For example, two of our team members acted out a data cluster record, which was a big hit for its humor and creativity.
JL and the Jets Team, Duke
Jonathan Levitan ‘24, Interdepartmental major in Statistical Science and Computer Science
Alex Katopodis ‘24, Computer Science and Statistics major
Jackson Peurach ‘24, Electrical Computer Science and Computer Science major
Miles King ‘24, Statistics and Mathematics major
How did your team come up with the ideas you presented about the dataset?
Alex: CourseKata wanted to know how they could help students learn “better.” We glanced at the features in the dataset and immediately realized this was going to be highly open ended. With that, our first step was to define “learn better.” This process actually took the entire first night and much of the next morning. We decided that performance, engagement, and effort all made sense as metrics given the features available to us. We initially tried coming up with a formula for these metrics but quickly realized that we didn’t have the subject expertise to do so. We opted to use clustering since this problem was inherently unsupervised. We don’t actually know how great of a performer, how engaged, and the amount of effort a student is putting in.
What was your most interesting insight into the dataset?
Jonathan: The most interesting thing we found was that the pulse questions — which are designed to measure how well a student is learning and retaining the material from the previous chapter — are somewhat of an inherently biased metric. For example, what if a high-performing student is just being humble? That’s what we aimed to do: augment these unreliable, self-reported metrics with more objective measurements of performance, engagement, and effort to help CourseKata work toward further personalizing the online educational experience.
Miles: Like Jonathan alluded to, by combining the objective performance and engagement metrics with the end-of-chapter self-evaluations given by students, we were able to group student learners into more nuanced categories than by just looking at the self-evaluations alone. By clustering students into these groups using a k-means approach, we were hoping to provide CourseKata with groups they could specifically tailor the learning experience to.
What advice would you give to a first-time DataFest team?
Alex: It’s really important to develop a very clear research question and project roadmap. Don’t be afraid to spend the first night and a good chunk of the main event day just brainstorming/performing EDA trying to figure these things out. Implementing the project will go much quicker if you know exactly what you’re trying to accomplish. Jonathan: Your first idea isn’t always your best idea, even if it’s tempting to take one look at the data and hit the ground running. It took us almost 24 hours for our work to really take shape, and I think we’re all glad we kept digging until we struck gold.
Jackson: DataFest gives you a lot of opportunity to be creative and think outside of the box in a risk free environment, so explore all the possibilities you can think of.
Miles: You don't need to use all of the data provided to you. It's easy to be overwhelmed by the scope of the data, but there were many phenomenal projects this year that looked at just a few variables from a particular section of the dataset. Find something that might be interesting and pursue that.
Anything else we should know about your experience at Duke DataFest?
Jonathan: Jackson Peurach also managed to win the Duke Softball Home Run Derby on the final day of DataFest and still made it back for the final presentation. If that’s not well-rounded, I don’t know what is.
Senam Adedze ‘24
Geography major with minors in data science and French
Team 08, UNC
How did your team come up with the ideas you presented about the dataset?
We really played around with the data and tried to ask questions we thought were interesting from a student perspective (e.g., what level of engagement is necessary to perform well in the course?)
Did working on this dataset give you any ideas about your own online learning experiences?
I think it was the opposite way around. My online learning experience helped inform how to analyze the dataset. For example, I think I took the chapter exit survey data with a grain of salt because I knew as a student, I would not pay much attention to it at the end of a chapter/homework assignment.
What was your most interesting insight into the dataset?
We found that those with average engagement and high engagement led to comparable performance results. This meant that the intervention goal for engagement should not be to maximize it overall, but focus on the subgroup of those with low engagement because that is where you can make the most impact. We also found that the ideal page length for engagement was 6 min long.
What advice would you give to a first-time DataFest team?
Just try to finish! Doesn't have to be fancy at all, it just needs to be something you can present. Keep your research question in mind always. It's easy to get caught up in fancy analyses that essentially have no direction/purpose.
Anything else we should know about your experience at Duke DataFest?
I had low expectations for how the weekend would go because I didn't form a group prior to datafest, and I was working with strangers. However, in just a short time, my group gelled and put together a presentation that won an honorable mention! I would say that even if you don't know anyone, just sign up, show up, and do your best!
Sam Reid ‘24
Math major, Data Science minor
Team 08, UNC
How did your team come up with the ideas you presented about the dataset?
It was a collaborative effort, and we had to revise our main thesis a number of times as we weren't able to find compelling evidence.
What was your most interesting insight into the dataset?
The least engaged students are doing much worse than the average student, compared to how much the most engaged students are doing better.
What advice would you give to a first-time DataFest team?
Focus on finding a compelling, "sellable" angle first, and once you have that go as deep as possible with the statistical methods you have at hand. Rather than applying every single method you can do the entire dataset while not saying much of anything. I think the main reason our team made is as far as we did despite not having the most advanced methods or pretty graphs was our ability to tie everything we had together into a compelling narrative that provided recommendations to the company.